Metrics, Maintenance, and Monitoring
Introduction
Monitoring is an important part of any system running semi-autonomously for any period of time if you value functionality. Knowing when you actually need to look at things is half the battle. I'd rather know when things break proactively than try to use a service only to find out that something isn't working. Backups failing silently are particularly scary. This is where a comprehensive monitoring and alerting system comes in.
Core Concepts
In cloud environments (which is what a homelab is), there are two key concepts for keeping operations going: monitoring and observability. I was initially under the impression that these were both the same thing, but even though they share certain features, they are different concepts.
Starting with a similarity, both monitoring and observability rely on telemetry—the best way to know what, if anything, is going on. The term telemetry is often used as a placeholder for metrics and vice versa, but their relationship is a parent-child one. Telemetry is data gathered by a remote system and transmitted to a central system for monitoring, analysis, and resource optimization. That data is usually in the form of metrics, events, logs, and traces (MELT), but there are many forms of telemetry that see everyday use.1
Fun Fact The heartbeats of the Apollo astronauts were one of the many metrics that made up the telemetry transmitting to mission control.
One aspect that sets observability and monitoring apart is what telemetry they use and how they use it. Monitoring relies on metrics: numerical measurements about the status of a system, like CPU usage, temperature, or throughput.2 This aspect of telemetry is crucial for monitoring the general status of systems and services within any environment. They are, however, limited.
Metrics need to be explicitly defined and emitted by the system being monitored. For example, node_exporter and cAdvisor are programs for exporting metrics about a *NIX based system and Docker, respectively. These secondary programs are required to aggregate system information and convert it into metrics.
Metrics are also only aggregate numbers, and can't provide a full picture of what is occurring within a system or application.3 They work well for generating alerts, reports, and visualizing individual system components, but getting a full picture is where observability comes in.
Monitoring is the when and what; observability is the why and how.4 Surprise, surprise—monitoring is different from observability because it is a component of observability. It integrates the remaining types of telemetry from MELT—events, logs, and traces—to provide critical insight into exactly what happened leading up to, during, and after any particular event. This level of detailed information comes at a cost: storage.
Generating metrics and retaining them for a period of time won't cause your hard drive space to fill up, but observability is expensive. The issue is mainly logs, which can balloon in size over time and require additional processing overhead.567 Metrics don't get to hide from this issue though; high cardinality in metrics, logs, and traces increases the storage and resource requirements of the system aggregating them.89 When we narrow down to the scope of a homelab, these are less of an issue.
Implementing full-blown observability in a homelab environment may have its benefits, but I find the trade-offs too great. For our purposes here, I will primarily focus on metrics and monitoring, not observability. I do aggregate some logs, dipping into that observability category; however, metrics are perfectly capable of fitting all my needs.
In the Beginning
I started with simple requirements—resource monitoring and a way to view docker logs— for which I used Beszel and Dozzle.10 Both of them use agents for deploying across distributed architecture which I appreciated for the networking simplicity. Only the main node had to be accessible to the agents, making writing ACLs and firewall rules simpler.
Beszel is a perfect solution for monitoring basic resource usage, system status, and docker container status with low resource overhead. It supports many notification providers through Apprise and allows you to define alerts on a per-host basis. However, it doesn't retain any of the metrics data it collects for an extended period of time. This is a feature, as it keeps the footprint smaller, but if you want to view more in depth data about devices over longer periods of time, you need to look elsewhere.
I'll elaborate on Dozzle later, as it is still a core part of my stack. It streams docker logs in real time, which I find much easier to navigate and monitor than trying to look through logs with Grafana.
The next step was retaining metrics and logs, at least for a short period, to better facilitate monitoring and incident investigation. This is something I had attempted before, when I had way fewer nodes and way less computing power. I found many of the existing tutorials daunting, and overkill for my situation. Things have changed, and I didn't need to look at any tutorials this time. Just me and the documentation, ready to work through anything.
The default stack in the homelab space seems to be Prometheus + Loki + Grafana, but I did things a bit differently.
Software Stack
Victoria Metrics
Victoria Metrics is a newer alternative TSDB to Prometheus. It serves as a drop in solution with a lower resource footprint. Victoria Metrics has a number of different solutions for every part of an observability stack with its own offerings for logs and traces. The ecosystem isn't as mature, but I can see it becoming popular in the homelab space due to its resource usage and ease of use.
One big advantage of Victoria Metrics is it's built in push gateway. No need to set up a separate service like with Prometheus, you can just to send data to the push URL. Without additional setup, you can push your own metrics with custom scripts and other tools.
Loki
Grafana Loki is a well-supported option for log processing. Fortunately, I'm not an enterprise who needs to worry about generating millions in costs due to my logs. My primary use for Loki is system logs, a few application logs, and docker logs. Loki pairs well with Dozzle, storing the logs for a longer period of time in case they're needed.
Dozzle
This is a fantastic, lightweight utility for query and monitoring docker logs in real time. It can also serve as a light container management platform by enabling container actions and shell access. Dozzle comes with a SQL engine for querying docker logs, which can be helpful to quickly find all issues across services. However, it doesn't store logs; it's meant for streaming them. When containers restart, those logs become inaccessible. This is where Loki comes in. It's easier to parse logs using dozzle, but I can store the logs with Loki if I need more in-depth analysis. Best of both worlds.
Alloy
I don't like the idea of locking myself into a vendor, but there isn't any arguing that Grafana is bog-standard in metrics and observability, and Alloy simplifies the process even more. It is an all-in-one gatherer for a variety of metrics. It's simple to set up and configure with services like Node Exporter and cAdvisor bundled with the program. Managing one configuration is easier than maintaining a Loki configuration, a Prometheus configuration, or whatever other scrap configurations are necessary. Alloy does it all, scraping, processing, and sharing metrics and logs.
Grafana publishes an Alloy installation role on Ansible Galaxy, which makes deployment a breeze. Ansible's built-in templating functions make building unique per-host configurations that much easier.
I decided to run Alloy on bare-metal as opposed to containerized, and this has some implications I had to work around. Alloy doesn't run as root by default, using its own dedicated user. This does cause issues with docker metrics, however. Even when added to the docker group on the system, Alloy, and it's underlying cAdvisor service can't access all the necessary directories without root privileges. Running the process with root permissions is not ideal or the solution here. I instead run a dedicate cAdvisor container on each node of my infrastructure. Letting one container run with elevated privileges is better than letting Alloy run with all the privileges.
Also, something to keep in mind—which may be obvious to some but let's be nice here—is that Alloy can't access files in your home directory by default. This became an issue for me when trying to access log files from services which all reside safely in my home directory. The solution is simple. Just move them to /var/log/ or some other publicly accessible directory.
Two things that will help a lot with running a homelab: Nine times out of ten, the issue is DNS or permissions.
Grafana
Everyone knows the whole point of this is just to set up pretty dashboards, so of course that's what I did! I use Grafana, like everyone else, but, like everyone else, it's for a reason. Grafana makes visualization of time-series data easy and fun. I love a good graph. I monitor my Caddy servers with this dashboard and my Crowdsec metrics with this dashboard with components from the official dashboards mixed in. Of course, I use Node Exporter Full and cAdvisor Exporter, and I have taken components from these to make my own dashboards, detailed below.
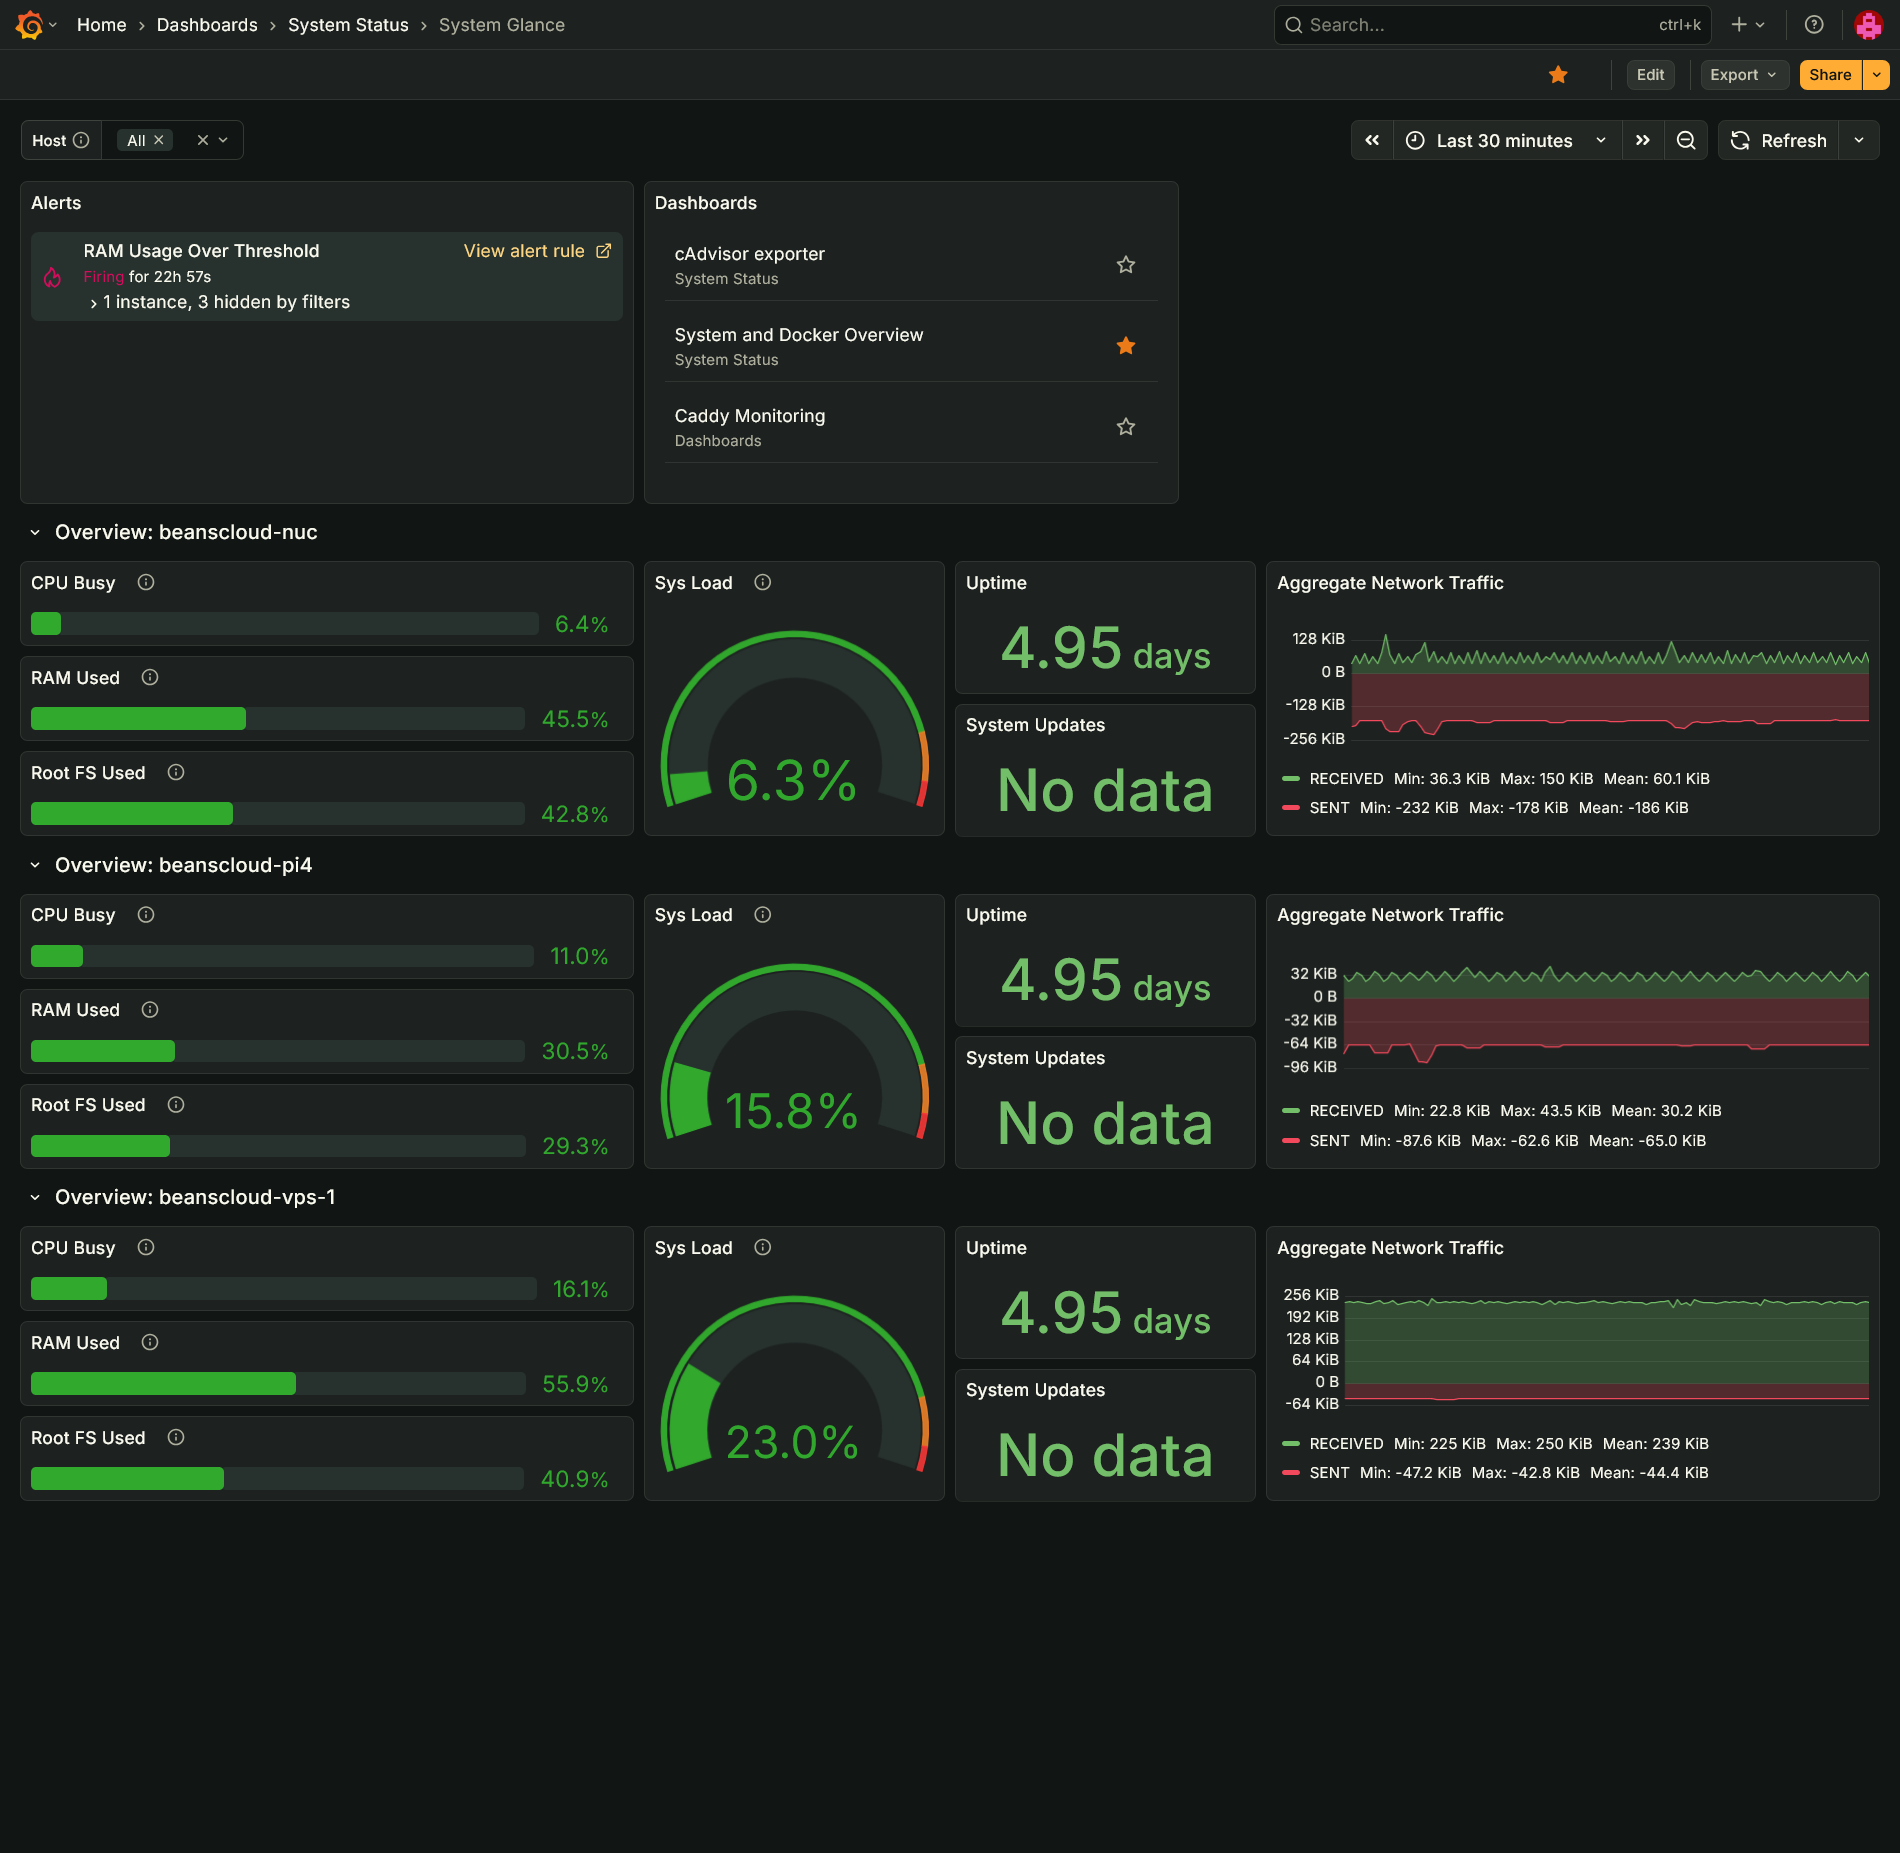
System Glance
This is my version of the Beszel dashboard in Grafana. It provides a quick glance at CPU, memory, system load, uptime, network traffic, available updates, and disk space used. It also includes quick access to other dashboards and any alerts.
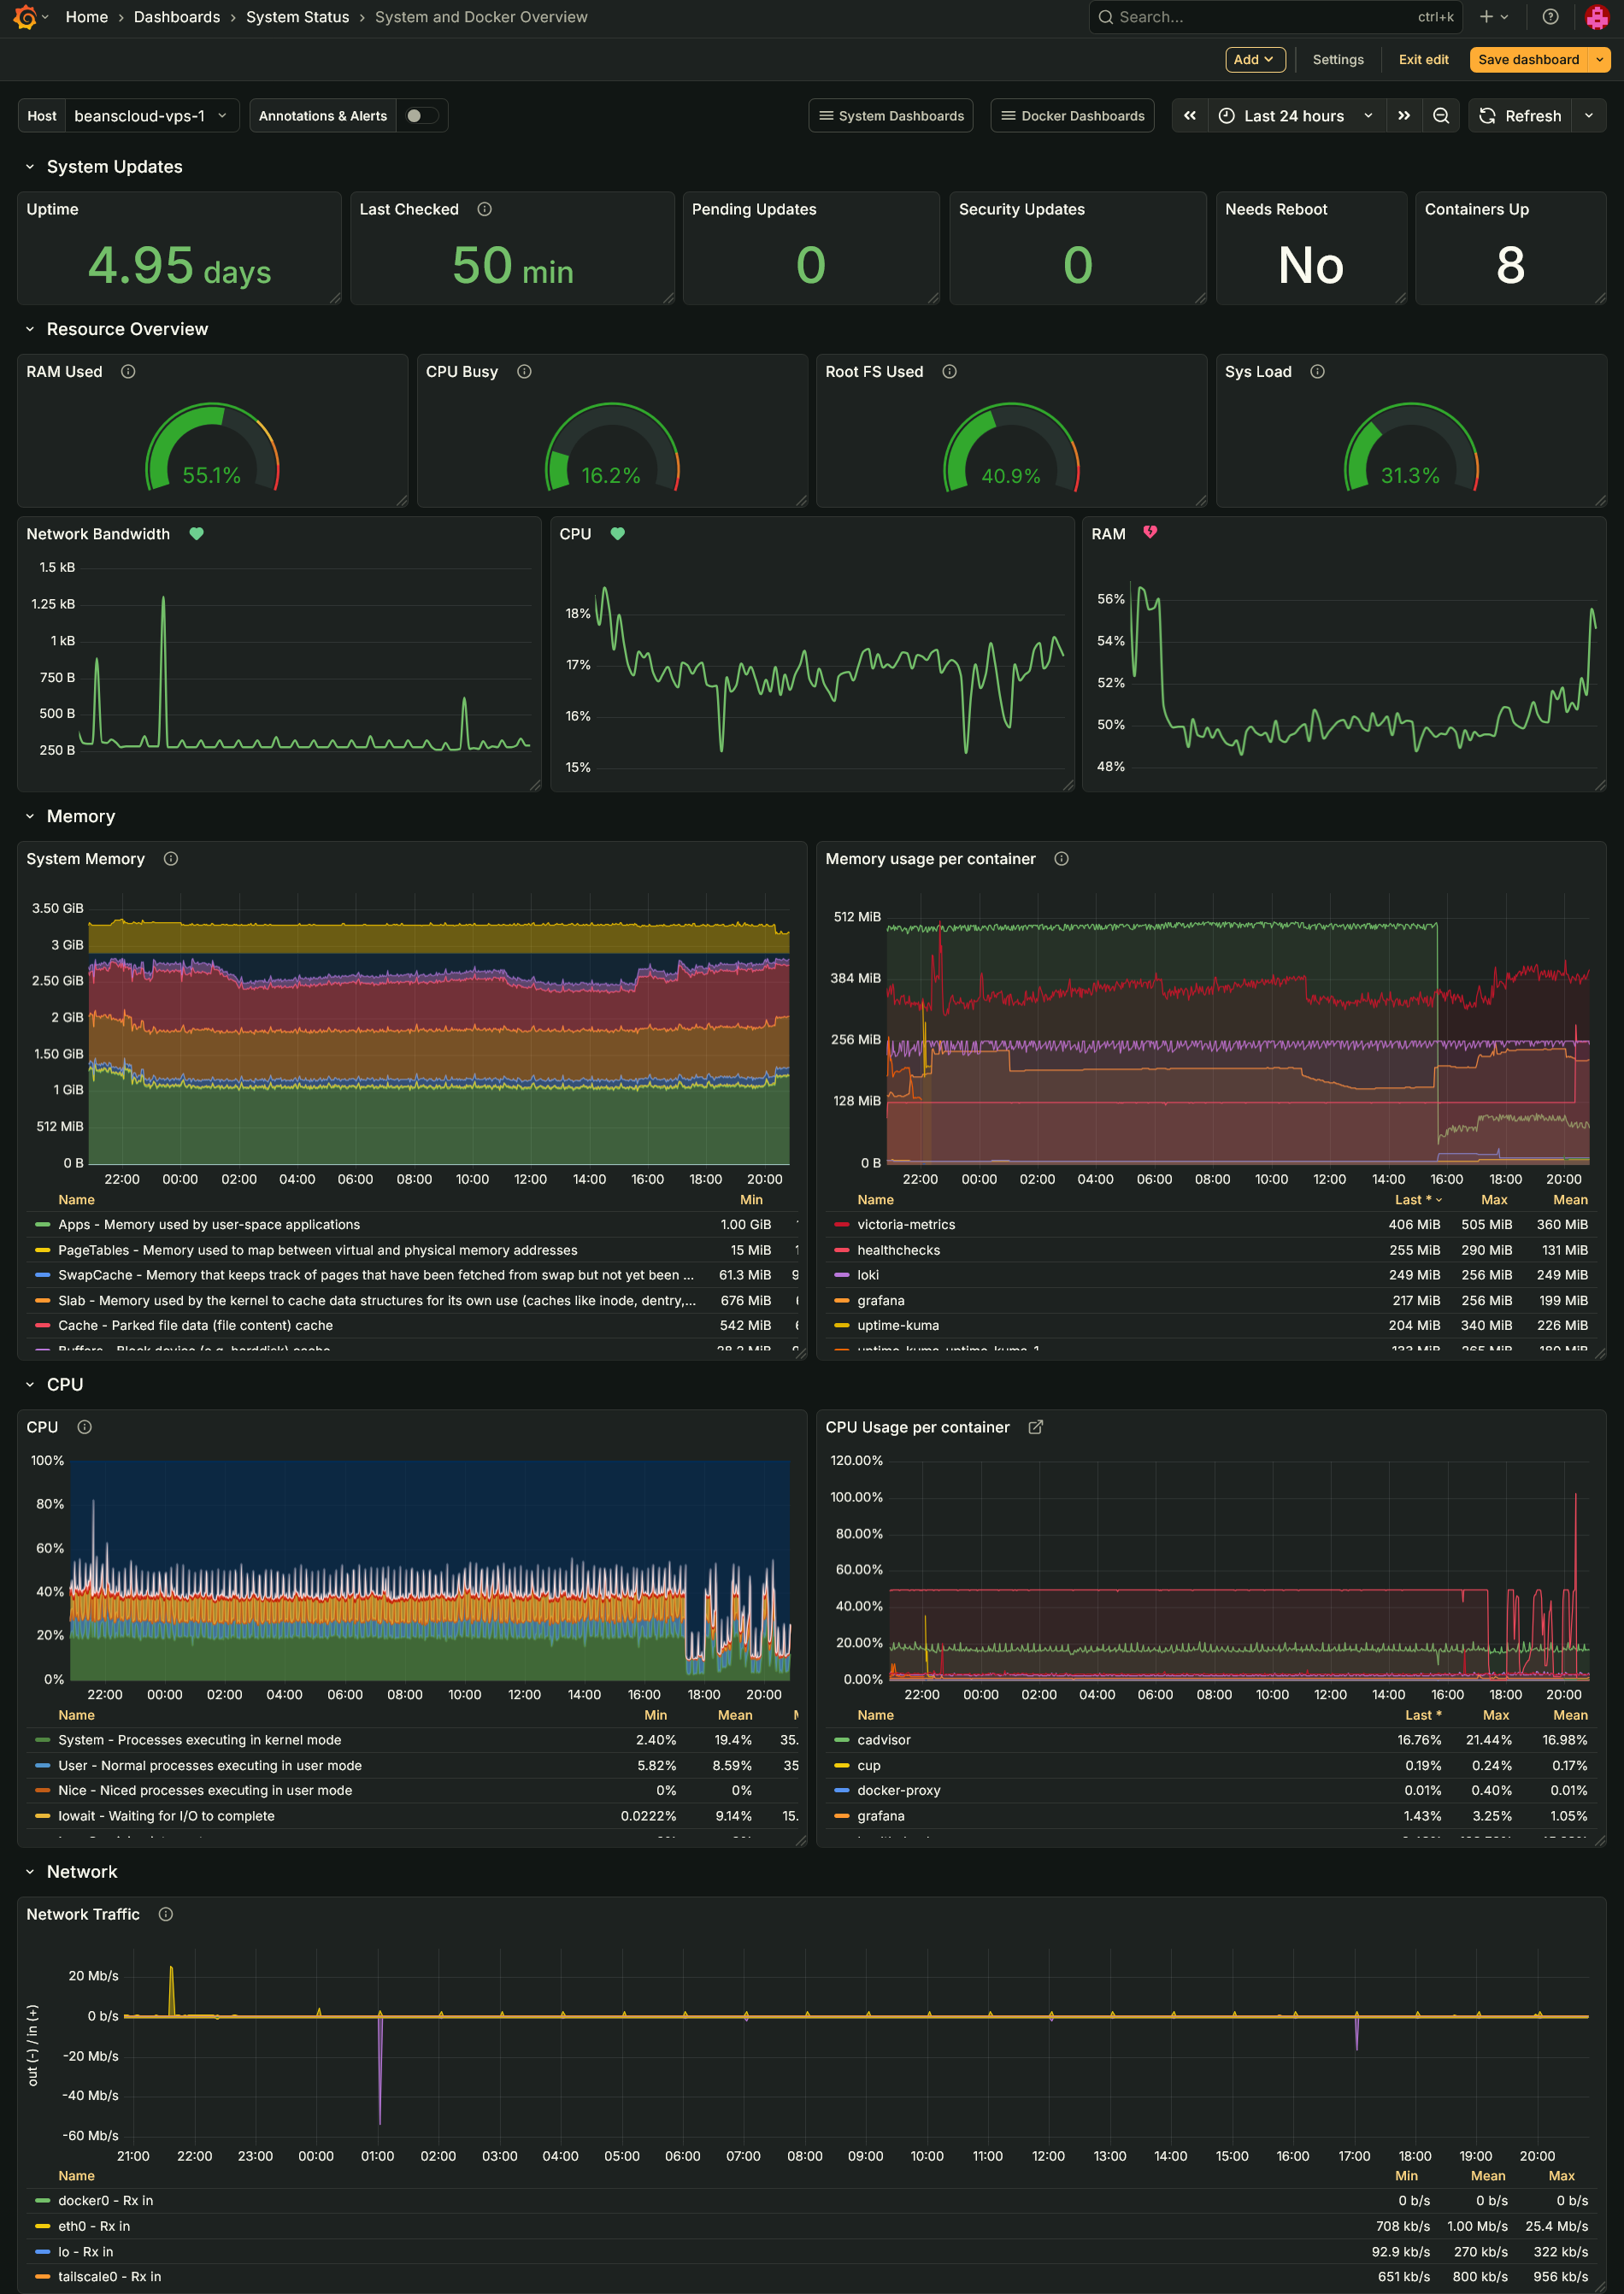
System and Docker Overview
I truly stand on the shoulders of giants here. This dash takes panels from Node Exporter Full and cAdvisor exporter. The goal is to provide more details about the system than the Glance board, but not the plethora of information the other boards display.
Healthchecks.io
Simple, reliable, and consistent, exactly the thing you need to ensure those boring routine tasks run without issue and on time. The hosted service has a nice free tier, but I will of course recommend hosting it yourself. It also exposes its own Prometheus metrics if you'd like to scrape those.
Uptime Kuma
A staple of the homelab, Uptime Kuma is dead simple and fully-featured uptime monitor. I could hypothetically replace Healthchecks with just Uptime Kuma using its push metrics, but the heartbeat model of Uptime Kuma doesn't fit with scheduled tasks whereas Healthchecks' primary function is monitoring scheduled tasks.
Maintenance
I used to use cron for scheduled tasks until I learned what systemd timers are, which work much better for my use case. The OnCalendar syntax takes a few minutes to get used to, but it ends up being more readable at a glance. One of the drawbacks of systemd timers is they lack the built-in mailing support cron does, but I use Healthchecks' pings to monitor my routine tasks anyway. systemd timers also require writing the unit file and timer file and enabling the service. Using Ansible simplifies this task. The positives far out way the drawbacks.
The more interesting maintenance tasks I run are my container and system updates checks. The former uses Python and queries the API of my local CUP container to retrieve any available container updates. It stores the timestamp and payload data on the disk. The script checks the previous state to determine whether a notification should trigger—the payload must be different or the last notification sent over 24 hours ago.
My system updates script uses Bash, and performs similar tasks to the container updates script. It stores the output of the command as JSON data which it reads back with jq to determine whether the data has changed or enough time has elapsed. As an additional feature, it sends metrics. Victoria Metrics built-in push gateway makes this so easy. All I need to do is send a POST request to the URL and I can easily enable metrics for any script I write.
Things to Consider
I'm currently considering some new apps to incorporate into my server management stack: replacing Loki with Victoria Logs for the decreased resource overhead; Arcane, an alternative to Portainer, for container management; PatchMon as a fully open source patch management platform.
I Am Looking
I'm now on top of the seven services I run on my homelab. It feels a little overkill, but the process has been a great—and at moments frustrating—experience. I got my hands dirty with writing PromQL and LogQL queries, using Ansible in full to reduce redundant efforts, and navigating how to avoid being overzealous with alerts. Overall a rewarding and educational experience. It has kicked off a full rewrite of how I deploy my services to use Ansible, but that's a story for later.
References
Ibid.↩
https://www.honeycomb.io/blog/how-much-should-i-spend-on-observability-pt1↩
https://newrelic.com/blog/observability/the-power-and-cost-of-data-cardinality↩
https://www.controltheory.com/blog/datadog-high-cardinality-logs/↩
Dozzle v10 released around the time of writing. Excited to try out the new features!↩